TEST CHARTS
RGB
These charts are specifically designed to facilitate the evaluation of color transformations whether utilizing native tools, DCTLs, or LUTs. The gradients on the charts display a spectrum of hues shifting along the horizontal axis, while the vertical axis represents lightness variations, providing a clear indication of how brightness levels influence colors. They are particularly valuable for scrutinizing the quality of color conversions. Any abrupt transitions or imperfections become visible, revealing a loss of detail in the shades’ progression and ensuring accurate color consistency in your work.

SCOPES
PREVIEW

DOWNLOAD
ko-fi.com (18 MB)
WORKING WITH LUTS
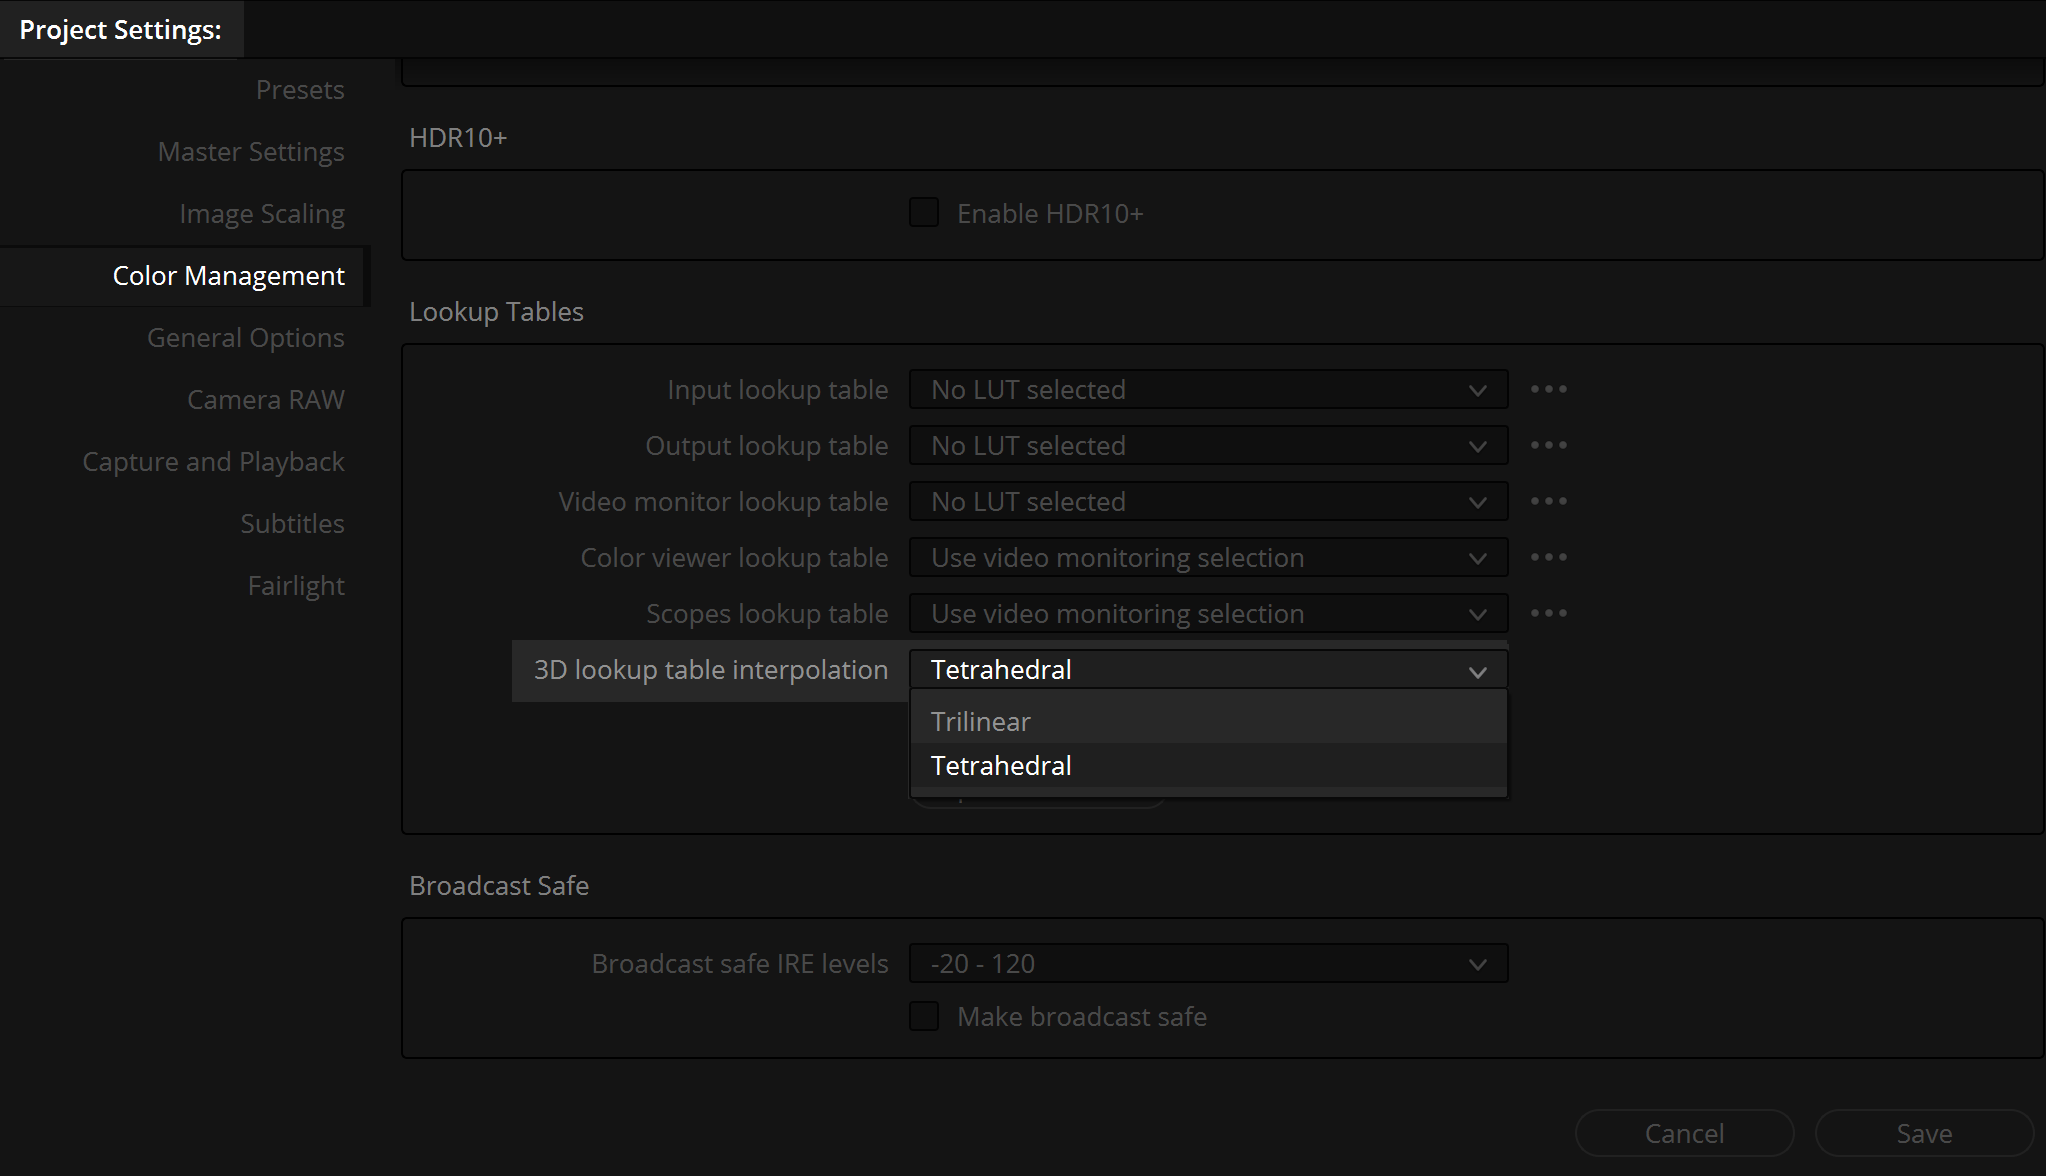
TRILINEAR / TETRAHEDRAL
There are two ways LUTs are interpolated in DaVinci Resolve. By default, it is set to “Trilinear”. It is better to switch to “Tetrahedral”. It takes a bit more processing power but it will give you much better, cleaner results.